|
Genecopoeia
t47d T47d, supplied by Genecopoeia, used in various techniques. Bioz Stars score: 95/100, based on 1 PubMed citations. ZERO BIAS - scores, article reviews, protocol conditions and more https://www.bioz.com/result/t47d/product/Genecopoeia Average 95 stars, based on 1 article reviews
t47d - by Bioz Stars,
2026-03
95/100 stars
|
Buy from Supplier |
|
TaKaRa
prc2 mi342 plasmids Prc2 Mi342 Plasmids, supplied by TaKaRa, used in various techniques. Bioz Stars score: 94/100, based on 1 PubMed citations. ZERO BIAS - scores, article reviews, protocol conditions and more https://www.bioz.com/result/prc2 mi342 plasmids/product/TaKaRa Average 94 stars, based on 1 article reviews
prc2 mi342 plasmids - by Bioz Stars,
2026-03
94/100 stars
|
Buy from Supplier |
|
Santa Cruz Biotechnology
crispr cas9 system mnt 1 cells Crispr Cas9 System Mnt 1 Cells, supplied by Santa Cruz Biotechnology, used in various techniques. Bioz Stars score: 92/100, based on 1 PubMed citations. ZERO BIAS - scores, article reviews, protocol conditions and more https://www.bioz.com/result/crispr cas9 system mnt 1 cells/product/Santa Cruz Biotechnology Average 92 stars, based on 1 article reviews
crispr cas9 system mnt 1 cells - by Bioz Stars,
2026-03
92/100 stars
|
Buy from Supplier |
|
Santa Cruz Biotechnology
scotin ko Scotin Ko, supplied by Santa Cruz Biotechnology, used in various techniques. Bioz Stars score: 93/100, based on 1 PubMed citations. ZERO BIAS - scores, article reviews, protocol conditions and more https://www.bioz.com/result/scotin ko/product/Santa Cruz Biotechnology Average 93 stars, based on 1 article reviews
scotin ko - by Bioz Stars,
2026-03
93/100 stars
|
Buy from Supplier |
|
Addgene inc
crispr cas9 gene editing Crispr Cas9 Gene Editing, supplied by Addgene inc, used in various techniques. Bioz Stars score: 96/100, based on 1 PubMed citations. ZERO BIAS - scores, article reviews, protocol conditions and more https://www.bioz.com/result/crispr cas9 gene editing/product/Addgene inc Average 96 stars, based on 1 article reviews
crispr cas9 gene editing - by Bioz Stars,
2026-03
96/100 stars
|
Buy from Supplier |
|
Santa Cruz Biotechnology
human zdhhc6 plasmid  Human Zdhhc6 Plasmid, supplied by Santa Cruz Biotechnology, used in various techniques. Bioz Stars score: 92/100, based on 1 PubMed citations. ZERO BIAS - scores, article reviews, protocol conditions and more https://www.bioz.com/result/human zdhhc6 plasmid/product/Santa Cruz Biotechnology Average 92 stars, based on 1 article reviews
human zdhhc6 plasmid - by Bioz Stars,
2026-03
92/100 stars
|
Buy from Supplier |
|
Proteintech
nat10 ko Nat10 Ko, supplied by Proteintech, used in various techniques. Bioz Stars score: 95/100, based on 1 PubMed citations. ZERO BIAS - scores, article reviews, protocol conditions and more https://www.bioz.com/result/nat10 ko/product/Proteintech Average 95 stars, based on 1 article reviews
nat10 ko - by Bioz Stars,
2026-03
95/100 stars
|
Buy from Supplier |
|
Santa Cruz Biotechnology
crispr cas9 plasmid Crispr Cas9 Plasmid, supplied by Santa Cruz Biotechnology, used in various techniques. Bioz Stars score: 95/100, based on 1 PubMed citations. ZERO BIAS - scores, article reviews, protocol conditions and more https://www.bioz.com/result/crispr cas9 plasmid/product/Santa Cruz Biotechnology Average 95 stars, based on 1 article reviews
crispr cas9 plasmid - by Bioz Stars,
2026-03
95/100 stars
|
Buy from Supplier |
|
Santa Cruz Biotechnology
crispr cas9 knockout kit Crispr Cas9 Knockout Kit, supplied by Santa Cruz Biotechnology, used in various techniques. Bioz Stars score: 93/100, based on 1 PubMed citations. ZERO BIAS - scores, article reviews, protocol conditions and more https://www.bioz.com/result/crispr cas9 knockout kit/product/Santa Cruz Biotechnology Average 93 stars, based on 1 article reviews
crispr cas9 knockout kit - by Bioz Stars,
2026-03
93/100 stars
|
Buy from Supplier |
|
Santa Cruz Biotechnology
crispr cas9 kit Crispr Cas9 Kit, supplied by Santa Cruz Biotechnology, used in various techniques. Bioz Stars score: 94/100, based on 1 PubMed citations. ZERO BIAS - scores, article reviews, protocol conditions and more https://www.bioz.com/result/crispr cas9 kit/product/Santa Cruz Biotechnology Average 94 stars, based on 1 article reviews
crispr cas9 kit - by Bioz Stars,
2026-03
94/100 stars
|
Buy from Supplier |
|
Danaher Inc
alt r crispr cas9 crrna targeting crebbp exon 26  Alt R Crispr Cas9 Crrna Targeting Crebbp Exon 26, supplied by Danaher Inc, used in various techniques. Bioz Stars score: 95/100, based on 1 PubMed citations. ZERO BIAS - scores, article reviews, protocol conditions and more https://www.bioz.com/result/alt r crispr cas9 crrna targeting crebbp exon 26/product/Danaher Inc Average 95 stars, based on 1 article reviews
alt r crispr cas9 crrna targeting crebbp exon 26 - by Bioz Stars,
2026-03
95/100 stars
|
Buy from Supplier |
|
Santa Cruz Biotechnology
chchd6 crispr  Chchd6 Crispr, supplied by Santa Cruz Biotechnology, used in various techniques. Bioz Stars score: 92/100, based on 1 PubMed citations. ZERO BIAS - scores, article reviews, protocol conditions and more https://www.bioz.com/result/chchd6 crispr/product/Santa Cruz Biotechnology Average 92 stars, based on 1 article reviews
chchd6 crispr - by Bioz Stars,
2026-03
92/100 stars
|
Buy from Supplier |
Image Search Results
Journal: Journal of experimental & clinical cancer research : CR
Article Title: Palmitoyltransferase ZDHHC6 promotes colon tumorigenesis by targeting PPARγ-driven lipid biosynthesis via regulating lipidome metabolic reprogramming.
doi: 10.1186/s13046-024-03154-0
Figure Lengend Snippet: Fig. 1 Identification of potential genes implicated in colorectal cancer (CRC) and cancer metabolism-associated biological processes. (A) A screening procedure to find putative gene candidates. (B) Colorectal cancer (CRC) samples were found to differ from adjacent controls in terms of physiopathology and biological processes related to metabolism in a number of databases, including TCGA, ICGC, and the NCBI Gene Expression Omnibus (GEO) datasets (GEO: GSE254054, GSE231943, GSE252858, GSE234804, GSE236678, GSE231436, GSE197088, and GSE239549). (C) Following gene differential expression analysis, the total number of differentially expressed genes that crossed over into various databases was counted. (D) Six upregulated and four down regulated DEGs were identified based on a survival analysis of differentially expressed genes across six databases.In the databases of TCGA and ICGC, P < 0.05 was deemed statistically significant. (E) Six upregulated and four downregulated DEGs represent the molecular mechanisms impacting the onset of colorectal cancer and metabolic reprogramming. (F) Palmitoyltransferase ZDHHC6 expression in the ICGC and TCGA databases. (G) Pancarcinoma analysis using TCGA datasets to measure ZDHHC6 expression levels in various malignancies. (H) The overall survival (OS) of colorectal cancer patients in the TCGA and ICGC databases according to different ZDHHC6 expression levels. (I) After dividing the TCGA and ICGC samples’ ZDHHC6 expression levels into groups of high and low expression levels, the grouped samples underwent GSEA analysis. The data were expressed as the mean ± SEM. A P value less than 0.05 was considered statistically significant. ***P < 0.001
Article Snippet: The readymade CRISPR/Cas9 KO products for
Techniques: Gene Expression, Quantitative Proteomics, Expressing

Journal: Journal of experimental & clinical cancer research : CR
Article Title: Palmitoyltransferase ZDHHC6 promotes colon tumorigenesis by targeting PPARγ-driven lipid biosynthesis via regulating lipidome metabolic reprogramming.
doi: 10.1186/s13046-024-03154-0
Figure Lengend Snippet: Fig. 2 Increased ZDHHC6 is positively associated with the development of human colorectal cancer (CRC). (A) ZDHHC6 mRNA expression levels in 73 pairs of CRC sample pairs (T) and their corresponding adjacent sample pairs (N). n = 73 pairs. (B) ZDHHC6 protein expression levels in sixteen pairs of similar adjacent tissues and colorectal cancer tissues selected at random. For each group, n = 3. (C) ZDHHC6 mRNA expression levels in relation to a range of CRC-associated cell lines, such as SNU-C2A, SW48, HT-29, LS1034, HCT116, and Caco-2, as well as the matching human normal colonic epithelial cell line (FHC), are displayed in qPCR analysis. For each group, n = 5. (D, E) ZDHHC6 protein expression in SNU-C2A, SW48, HT-29, LS1034, HCT116, Caco-2, and FHC cell line as demonstrated by western blotting (D) and immunofluorescence analysis (E). 200 μm; each group has n = 5. (F, G) qPCR analysis (F) and western blotting experiment (G) demonstrate the effect of the gradually increased dosage of 2-bromopalmitate (2-BP) on the relative ZDHHC6 mRNA and protein expression levels in HCT116, SNU-C2A, SW48, and Caco-2 cell lines. For each group, n = 3. (H) An immunofluorescence assay demonstrating the co-expression of ZDHHC6 and Ki67 in response to 40 µM 2-bromopalmitate (2-BP) in HCT116, SNU-C2A, SW48, and Caco-2 cell lines. 200 μm; each group has n = 3. Data are expressed as mean ± SEM. The relevant experiments presented in this section were performed independently at least three times. P < 0.05 indicates statistical significance
Article Snippet: The readymade CRISPR/Cas9 KO products for
Techniques: Expressing, Western Blot, Immunofluorescence
![Fig. 4 ZDHHC6 facilitates lipid deposition and carcinogenesis in CRC cells. (A) A venn diagram shows the variations in metabolites produced by HCT116 cells with ZDHHC6 knockout (KO) and wild-type (WT) phenotypes. ZDHHC6 and fatty acid synthesis pathways have a significant association, according to pathway enrichment analysis of the 36 metabolites. Total peak area was used to correct the LC-MS-based untargeted metabolomic study and its findings. (B) Using these 36 differential metabolites, pathway analysis showed enhanced signaling pathways. (www.metaboanalyst.ca). (C) A heatmap showing how these 36 significantly altered metabolites changed. Student’s t-test, unpaired, two-tailed, P < 0.05. The fold change is indicated by -2.0 ~ 2.0 (Fc). (D, E) The ratios of various isotopic forms of FFA C16:0 (palmitate) in ZDHHC6 (KO) (D) and AdZDHHC6 (E) HCT116 cells after a brief exposure to glucose [U-13C]. When the cell density was around 85%, the media was changed to RPMI 1640 containing 2 g/L glucose tagged with [U-13C]. Following a 24-hour period, the PBS-rinsed cell culture plates were quickly frozen in liquid nitrogen and subjected to an LC-MS assay analysis (n = 4 per group). (F) Representative im munofluorescence pictures of HCT116 cells with ZDHHC6 (WT) and ZDHHC6 (KO) phenotypic, demonstrating ZDHHC6 expression, lipid accumulation (Bodipy staining), and corresponding intracellular triglyceride (TG) levels (n = 4 per group). (G, H) ZDHHC6 (WT) and ZDHHC6 (KO) HCT116 cells were injected into the right flanks of nude mice. Every two days, tumor volumes were measured. On day 22 following dissection, tumor pictures (G), growth curves, and weight (H) were recorded (n = 4 per group). Scale bars, 1 cm. (I) A heatmap utilizing untargeted metabolomic analysis comparing significantly changed metabolites between tumors originating from ZDHHC6 (KO) HCT116 cells and ZDHHC6 (WT) cell lines. Data are expressed as mean ± SEM. The relevant experiments presented in this part were performed independently at least three times. P < 0.05 indicates statistical significance](https://pub-med-unpaywalled-images-cdn.bioz.com/pub_med_ids_ending_with_8124/pm39148124/pm39148124__page15_image1.jpg)
Journal: Journal of experimental & clinical cancer research : CR
Article Title: Palmitoyltransferase ZDHHC6 promotes colon tumorigenesis by targeting PPARγ-driven lipid biosynthesis via regulating lipidome metabolic reprogramming.
doi: 10.1186/s13046-024-03154-0
Figure Lengend Snippet: Fig. 4 ZDHHC6 facilitates lipid deposition and carcinogenesis in CRC cells. (A) A venn diagram shows the variations in metabolites produced by HCT116 cells with ZDHHC6 knockout (KO) and wild-type (WT) phenotypes. ZDHHC6 and fatty acid synthesis pathways have a significant association, according to pathway enrichment analysis of the 36 metabolites. Total peak area was used to correct the LC-MS-based untargeted metabolomic study and its findings. (B) Using these 36 differential metabolites, pathway analysis showed enhanced signaling pathways. (www.metaboanalyst.ca). (C) A heatmap showing how these 36 significantly altered metabolites changed. Student’s t-test, unpaired, two-tailed, P < 0.05. The fold change is indicated by -2.0 ~ 2.0 (Fc). (D, E) The ratios of various isotopic forms of FFA C16:0 (palmitate) in ZDHHC6 (KO) (D) and AdZDHHC6 (E) HCT116 cells after a brief exposure to glucose [U-13C]. When the cell density was around 85%, the media was changed to RPMI 1640 containing 2 g/L glucose tagged with [U-13C]. Following a 24-hour period, the PBS-rinsed cell culture plates were quickly frozen in liquid nitrogen and subjected to an LC-MS assay analysis (n = 4 per group). (F) Representative im munofluorescence pictures of HCT116 cells with ZDHHC6 (WT) and ZDHHC6 (KO) phenotypic, demonstrating ZDHHC6 expression, lipid accumulation (Bodipy staining), and corresponding intracellular triglyceride (TG) levels (n = 4 per group). (G, H) ZDHHC6 (WT) and ZDHHC6 (KO) HCT116 cells were injected into the right flanks of nude mice. Every two days, tumor volumes were measured. On day 22 following dissection, tumor pictures (G), growth curves, and weight (H) were recorded (n = 4 per group). Scale bars, 1 cm. (I) A heatmap utilizing untargeted metabolomic analysis comparing significantly changed metabolites between tumors originating from ZDHHC6 (KO) HCT116 cells and ZDHHC6 (WT) cell lines. Data are expressed as mean ± SEM. The relevant experiments presented in this part were performed independently at least three times. P < 0.05 indicates statistical significance
Article Snippet: The readymade CRISPR/Cas9 KO products for
Techniques: Produced, Knock-Out, Liquid Chromatography with Mass Spectroscopy, Protein-Protein interactions, Two Tailed Test, Cell Culture, Expressing, Staining, Injection, Dissection

Journal: Journal of experimental & clinical cancer research : CR
Article Title: Palmitoyltransferase ZDHHC6 promotes colon tumorigenesis by targeting PPARγ-driven lipid biosynthesis via regulating lipidome metabolic reprogramming.
doi: 10.1186/s13046-024-03154-0
Figure Lengend Snippet: Fig. 5 ZDHHC6 specifically binds to the lipid metabolism key transcription factor of PPARγ. (A) After 24 h of SFB-ZDHHC6 transfection in HCT116 cells, ZDHHC6-interacting proteins were identified by tandem affinity purification and mass spectrometry (MS). This was accomplished by removing S-protein, Flag, and streptavidin binding peptide (SFB). (B) ZDHHC6 or IgG antibodies were used to immunoprecipitate HCT116 cell lysates, and PPARγ, PPARα, PPARδ, SREBP1, and ZDHHC6 antibodies were used for western blotting experiments. (C) ZDHHC6 or IgG antibodies were used to immunoprecipitate cellular lysates of SNU-C2A, SW48, HT-29, LS1034, and Caco-2 cells, and ZDHHC6 or PPARγ antibodies were used for western blotting experiments. (D) GST pulldown assay using GST-PPARγ and purified His-ZDHHC6 in HCT116 cells. (E) Schematic of the experimental procedure showing the genes expression in HCT116, Caco-2, SNU-C2A and HT-29 after adenovirus-mediated ZDHHC6 overactivation (AdZDHHC6). The lower schematic diagram showing the inter section of the results from the proteomics and IP-MS analyses. (F) For a duration of 24 h, plasmids expressing Flag-PPARγ or Myc-ZDHHC6 individually or in combination were transfected into HCT116, Caco-2, SNU-C2A and HT-29 cells, respectively. His or Flag antibodies were used for immunoblotting after cellular lysates had been immunoprecipitated with Flag and/or His antibodies. (G) GST pulldown assay using GST-PPARγ and purified Flag-ZDHHC6 in Caco-2 and SNU-C2A cells, respectively. (H) Assay for immunofluorescence staining demonstrating ZDHHC6 and PPARγ co-expression in HCT116, Caco-2, and SNU-C2A cells. 20 μm. (I) In HCT116 cells, vectors containing the hinge-LBD domain, full length (FL), AF-1, DBD, and PPARγ were co-expressed with SFB-ZDHHC6. S-bead pulldown was used to immunoprecipitate cellular lysates. (J) Based on GSEA signaling pathway analysis, an assay of the TCGA-CRC and ICGC-CRC datasets showed a significant connection between ZDHHC6 and the PPARγ pathway in CRC. Data are expressed as mean ± SEM. The rel evant experiments presented in this part were performed independently at least three times. P < 0.05 indicates statistical significance
Article Snippet: The readymade CRISPR/Cas9 KO products for
Techniques: Transfection, Affinity Purification, Mass Spectrometry, Binding Assay, Western Blot, GST Pulldown Assay, Purification, Expressing, Protein-Protein interactions, Immunoprecipitation, Immunofluorescence, Staining

Journal: Journal of experimental & clinical cancer research : CR
Article Title: Palmitoyltransferase ZDHHC6 promotes colon tumorigenesis by targeting PPARγ-driven lipid biosynthesis via regulating lipidome metabolic reprogramming.
doi: 10.1186/s13046-024-03154-0
Figure Lengend Snippet: Fig. 6 Identification of the palmitoylation site on PPARγ at evolutionarily conserved cysteine residues. (A) For a duration of 24 h, HCT116 cells were exposed to 60 µM 2-BP, 1 µM ABD957, 6 µM palmostatin B (Palm B), and 10 µM palmostatin M (Palm M) treatments. The slices that were fixed underwent immunofluorescence labeling using PPARγ (red) and pan-palmitoylation (green). 10 μm scale bars; n = 5 per group. (B) Schematic diagram of the Click-iT assay for palmitoylation measurement of PPARγ. HCT116 cells were treated with 100 µM Click-iT PA and azides for five hours. The resulting lysates were then submitted to Click-iT detection as per the product instructions, and PPARγ antibody western blotting analysis was performed. The indicated group’s expression of PPARγ is indicated by the western blotting bands on the right. (C) Using the GPS-Palm program (MacOS_20200219) (The CUCKOO Work group, http://gpspalm.biocuckoo.cn/) and the MDD-Palm algorithm (http://csb.cse.yzu.edu.tw/MDDPalm/), the palmitoylation site on PPARγ in Homo sapiens (upper) and Mus musculus (lower) is predicted to be located. PPARγ’s lower palmitoylation site contains conserved cysteine residues shared by Rattus norvegicus, Bos taurus, Canis familiaris, Mus musculus, and Homo sapiens. (D) After incubating Click-iT PA and azides for five hours on HCT116 cells overexpressing either PPARγ WT or PPARγ C313S mutant, the corresponding cellular lysates were obtained and Click-iT detection was performed in com pliance with the product’s instructions. After the palmitoylated proteins were added to the streptavidin-sepharose bead conjugate for pull-down detec tion, PPARγ and ACTIN antibodies were used in a western blotting examination. While PPARγ C313S was not palmitoylated in top gel, lane 6, or the control groups, it was for PPARγ WT in lane 5. Three separate runs of this experiment were conducted. (E) CHX was cultured with HCT116 cells overexpressing either the PPARγ WT or PPARγ C313S mutant for a specific amount of time. PPARγ and ACTIN antibodies were used in immunoblotting detection of the obtained cellular lysates. The relative PPARγ remaining ratio (n = 4 per group) is displayed in the right curve graph at the specified time point. (F) PPARγ WT or PPARγ C313S mutant overexpression was observed in the upper HCT116 cells. Pan-palmitoylation (green) and PPARγ (red) immunofluorescent label ing were applied to the cell sections. Lower, AdZDHHC6 + PPARγ C313S mutant or PPARγ C313S alone were overexpressed in HCT116 cells, respectively. The bar graph displays the intensity of PPARγ fluorescence in each of the indicated groups (n = 5 pictures; P < 0.05 vs. PPARγ C313S + AdControl or PPARγ WT). Scale bars, 20 μm. (G) In HCT116 cells, PPARγ-Flag and ZDHHC6-HA plasmids were transfected. Alk16 labeling was used to determine the palmi toylated PPARγ expression contents in the presence or absence of hydroxylamine therapy. (H) PPARγ-Flag was used to transfect SNU-C2A cells (WT) or ZDHHC6-deleted SNU-C2A cells, and Alk16 was used to label the cells. Subcellular fraction was extracted, and the levels of PPARγ protein were adjusted to verify that the input cells from the wild type and the knockout cell had the same quantity of PPARγ. Immunoblotting analysis was used to evaluate the palmitoylated PPARγ expression contents in the cell membrane (Mem.), cell cytoplasm (Cyto.), and cell nucleus (Nuc.) components. Data are expressed as mean ± SEM. The relevant experiments presented in this part were performed independently at least three times. P < 0.05 indicates statistical significance
Article Snippet: The readymade CRISPR/Cas9 KO products for
Techniques: Immunofluorescence, Labeling, Western Blot, Expressing, Mutagenesis, Control, Cell Culture, Over Expression, Fluorescence, Transfection, Knock-Out, Membrane

Journal: Journal of experimental & clinical cancer research : CR
Article Title: Palmitoyltransferase ZDHHC6 promotes colon tumorigenesis by targeting PPARγ-driven lipid biosynthesis via regulating lipidome metabolic reprogramming.
doi: 10.1186/s13046-024-03154-0
Figure Lengend Snippet: Fig. 7 ZDHHC6-mediated palmitoylated PPARγ enhances its nucleus translocalization. (A) ZDHHC6 and PPARγ expression were examined in the ZDH HC6-deleted HCT116, SNU-C2A and SW48 cells, respectively (n = 3 per group). (B) ZDHHC6 and PPARγ co-expression in AdshZDHHC6-transfected HCT116 cells, along with the matching fluorescence density as determined by Pearson’s analysis (n = 4 per group; P < 0.05 vs. AdshRNA). The scale bars are 20 μm. (C) In ZDHHC6-deleted HCT116 or ZDHHC6-deleted SW48 cells, palmitoylation levels and PPARγ expression were analyzed using western blotting assay (n = 4 per group). (D) Western blotting assay using PPARγ, ACTIN, and HA antibodies, followed by PPARγ overexpressing the HA-tagged ZDHHC6 construct in various CRC cell lines (n = 3 per group). (E) Immunofluorescence pictures demonstrating the co-expression of PPARγ and ZDHHC6 in ZDHHC6-overex pressed HCT116 cells, together with the matching fluorescence density as determined by Pearson’s analysis (n = 4 per group; P < 0.05 compared to empty vector). The scale bars are 20 μm. (F) HCT116 cells underwent IP of HA after co-transfecting with PPARγ and HA-ZDHHC6. ZDHHC6 and PPARγ Mutual Co-IP shows that endogenous ZDHHC6 and PPARγ bind to each other in HCT116 cells. (G) Using various alkyl-labeled fatty acylation, such as alk-C14, alk- C16, alk-C18, and alk-C20, the palmitoylation of PPARγ in the indicated cells was detected. By using streptavidin bead pulldown to identify acylated PPARγ, an immunoblotting experiment using PPARγ and ACTIN antibodies (n = 6 per group) was performed. (H) To identify acylated PPARγ in SW48, LS1034, and HT-29 cells, the same methodology as in (G) was applied. Following that, the lysates (n = 6 per group) were subjected to western blotting analysis using PPARγ and ACTIN antibodies. (I) Using Click reaction-associated streptavidin pulldown, the palmitoylation levels of Flag-labeled PPARγ WT, PPARγ C313S, PPARγ C156S, PPARγ C176S, and PPARγ C159S mutants were examined. Three individuals per group underwent an immunoblotting experiment using Flag and ACTIN antibodies on the relevant lysates. (J) ZDHHC6-HA and PPARγ-Flag were the vectors used to transfect the HCT116 cells. Using alk-C16 labeling, higher, palmitoylated PPARγ levels were demonstrated in both the presence and absence of hydroxylamine therapy. The corresponding fluorescence density and ACLY and PPARγ co-expression in HCT116 WT or HCT116 ZDHHC6 (KO) cells are depicted in the lower representative immunofluorescence images, which were analyzed using Pearson’s method (n = 5 per group; P < 0.05 vs. WT). The scale bars are 20 μm. (K) After transfecting the HCT116 WT or HCT116 ZDHHC6 (KO) cells with PPARγ-Flag, the cells were labeled with alk-C16. To verify that the wild type and knockout cell components for input had the same quantity of PPARγ, subcellular fraction was obtained and PPARγ protein levels were adjusted. Western blotting analysis was used to assess palmitoylated PPARγ levels in the cell membrane (Mem.), cell cytoplasm (Cyto. ), and cell nucleus (Nuc.) components. Data are expressed as mean ± SEM. The relevant experiments presented in this part were performed independently at least three times. P < 0.05 indicates statistical significance
Article Snippet: The readymade CRISPR/Cas9 KO products for
Techniques: Expressing, Transfection, Fluorescence, Western Blot, Construct, Immunofluorescence, Plasmid Preparation, Co-Immunoprecipitation Assay, Labeling, Knock-Out, Membrane
![Fig. 9 ZDHHC6-driven lipid biosynthesis contributes to CRC carcinogen esis by upregulating PPARγ. (A, B) In HCT116-related stable cells (Control, ZDHHC6, and ZDHHC6 + shPPARγ) (A) and HCT116-related stable cells (shControl, shZDHHC6, and shZDHHC6 + PPARγ) (B), the percentages of different isotopomers of FFA C16:0 following exposure to [U-13C] glucose are shown. Each group has n = 5. (C, D) The relative TG content and PPARγ expression abundance in the aforementioned cell lines from (A) and (B) are displayed in representative immunofluorescence pictures. Each group has n = 5. The scale bars are 20 μm. (E) In null mice, right flanks were in jected with ZDHHC6 + shPPARγ, ZDHHC6, and Control, stable cells related to HCT116. Every two days, tumor volumes were measured. Weight and tumor growth curves were measured 22 days following dissection. Each group has n = 5. (F) The right flanks of null mice were injected with shCon trol, shZDHHC6, and shZDHHC6 + PPARγ, stable cells linked to HCT116. Every two days, tumor volumes were measured. Weight and tumor growth curves were measured 22 days following dissection. Each group has n = 5. (G) Kaplan-Meier curves representing the survival analysis based on TCGA CRC prognostic data for ZDHHC6-positive, PPARγ-positive, and ZDHHC6 & PPARγ co-positive patients. (H) Based on the prognosis information from the ICGC CRC database, Kaplan-Meier curves were used to analyze the sur vival of ZDHHC6-positive, PPARγ-positive, and ZDHHC6 & PPARγ co-posi tive patients. Data are expressed as mean ± SEM. The relevant experiments presented in this part were performed independently at least three times. P < 0.05 indicates statistical significance](https://pub-med-unpaywalled-images-cdn.bioz.com/pub_med_ids_ending_with_8124/pm39148124/pm39148124__page23_image1.jpg)
Journal: Journal of experimental & clinical cancer research : CR
Article Title: Palmitoyltransferase ZDHHC6 promotes colon tumorigenesis by targeting PPARγ-driven lipid biosynthesis via regulating lipidome metabolic reprogramming.
doi: 10.1186/s13046-024-03154-0
Figure Lengend Snippet: Fig. 9 ZDHHC6-driven lipid biosynthesis contributes to CRC carcinogen esis by upregulating PPARγ. (A, B) In HCT116-related stable cells (Control, ZDHHC6, and ZDHHC6 + shPPARγ) (A) and HCT116-related stable cells (shControl, shZDHHC6, and shZDHHC6 + PPARγ) (B), the percentages of different isotopomers of FFA C16:0 following exposure to [U-13C] glucose are shown. Each group has n = 5. (C, D) The relative TG content and PPARγ expression abundance in the aforementioned cell lines from (A) and (B) are displayed in representative immunofluorescence pictures. Each group has n = 5. The scale bars are 20 μm. (E) In null mice, right flanks were in jected with ZDHHC6 + shPPARγ, ZDHHC6, and Control, stable cells related to HCT116. Every two days, tumor volumes were measured. Weight and tumor growth curves were measured 22 days following dissection. Each group has n = 5. (F) The right flanks of null mice were injected with shCon trol, shZDHHC6, and shZDHHC6 + PPARγ, stable cells linked to HCT116. Every two days, tumor volumes were measured. Weight and tumor growth curves were measured 22 days following dissection. Each group has n = 5. (G) Kaplan-Meier curves representing the survival analysis based on TCGA CRC prognostic data for ZDHHC6-positive, PPARγ-positive, and ZDHHC6 & PPARγ co-positive patients. (H) Based on the prognosis information from the ICGC CRC database, Kaplan-Meier curves were used to analyze the sur vival of ZDHHC6-positive, PPARγ-positive, and ZDHHC6 & PPARγ co-posi tive patients. Data are expressed as mean ± SEM. The relevant experiments presented in this part were performed independently at least three times. P < 0.05 indicates statistical significance
Article Snippet: The readymade CRISPR/Cas9 KO products for
Techniques: Control, Expressing, Immunofluorescence, Dissection, Injection

Journal: Journal of experimental & clinical cancer research : CR
Article Title: Palmitoyltransferase ZDHHC6 promotes colon tumorigenesis by targeting PPARγ-driven lipid biosynthesis via regulating lipidome metabolic reprogramming.
doi: 10.1186/s13046-024-03154-0
Figure Lengend Snippet: Fig. 10 Palmitoylation stabilizes PPARγ by ZDHHC6 via blocking its lysosomal degradation to promotes lipid biosynthesis-associated CRC development. As a palmitoyltransferase enzyme, ZDHHC6 regulates the synthesis of fatty acids. To be more precise, ZDHHC6 directly attaches palmitoyl groups to PPARγ, a protein that controls the expression of genes. By stabilizing PPARγ and blocking its lysosomal degradation, the palmitoylation mechanism triggers the production of ACLY and subsequently leads to the development of lipid buildup-related CRC carcinogenesis
Article Snippet: The readymade CRISPR/Cas9 KO products for
Techniques: Blocking Assay, Expressing
Journal: bioRxiv
Article Title: Cooperative super-enhancer inactivation caused by heterozygous loss of CREBBP and KMT2D skews B cell fate decisions and yields T cell-depleted lymphomas
doi: 10.1101/2023.02.13.528351
Figure Lengend Snippet: A , Odds ratio (OR) analysis of CREBBP and KMT2D mutations among EZB/Cluster3 DLBCL (n=319) and FL_all (merged FL datasets, n=478) cohorts of patients. The p values were calculated by Fisher’s exact test. B , Representative H&E and B220 IHC images of formalin-fixed paraffin-embedded kidney and liver sections prepared from mice euthanized at day 116 post-BMT. The scale bars represent 380 pixels. C , Representative H&E, B220 and Ki67 IHC images of formalin-fixed paraffin-embedded spleen sections from mice euthanized at day 235 post-BMT. The scale bars represent 200 pixels. D , Representative FACS plots show the gating strategy and frequency of B220 + CD38 - FAS + splenic GC B cells in mice at day 235 post-BMT. E , FACS analysis showing the relative abundance of splenic total B cells (B220 + ) normalized to total single cells at day 116 and 235 post-BMT (mean ± SD). Each dot represents a mouse (n=4 mice per genotype).
Article Snippet: HiFi Cas9 Nuclease (IDT; 1081061), Alt-R CRISPR-Cas9 tracrRNA (
Techniques: Formalin-fixed Paraffin-Embedded
Journal: bioRxiv
Article Title: Cooperative super-enhancer inactivation caused by heterozygous loss of CREBBP and KMT2D skews B cell fate decisions and yields T cell-depleted lymphomas
doi: 10.1101/2023.02.13.528351
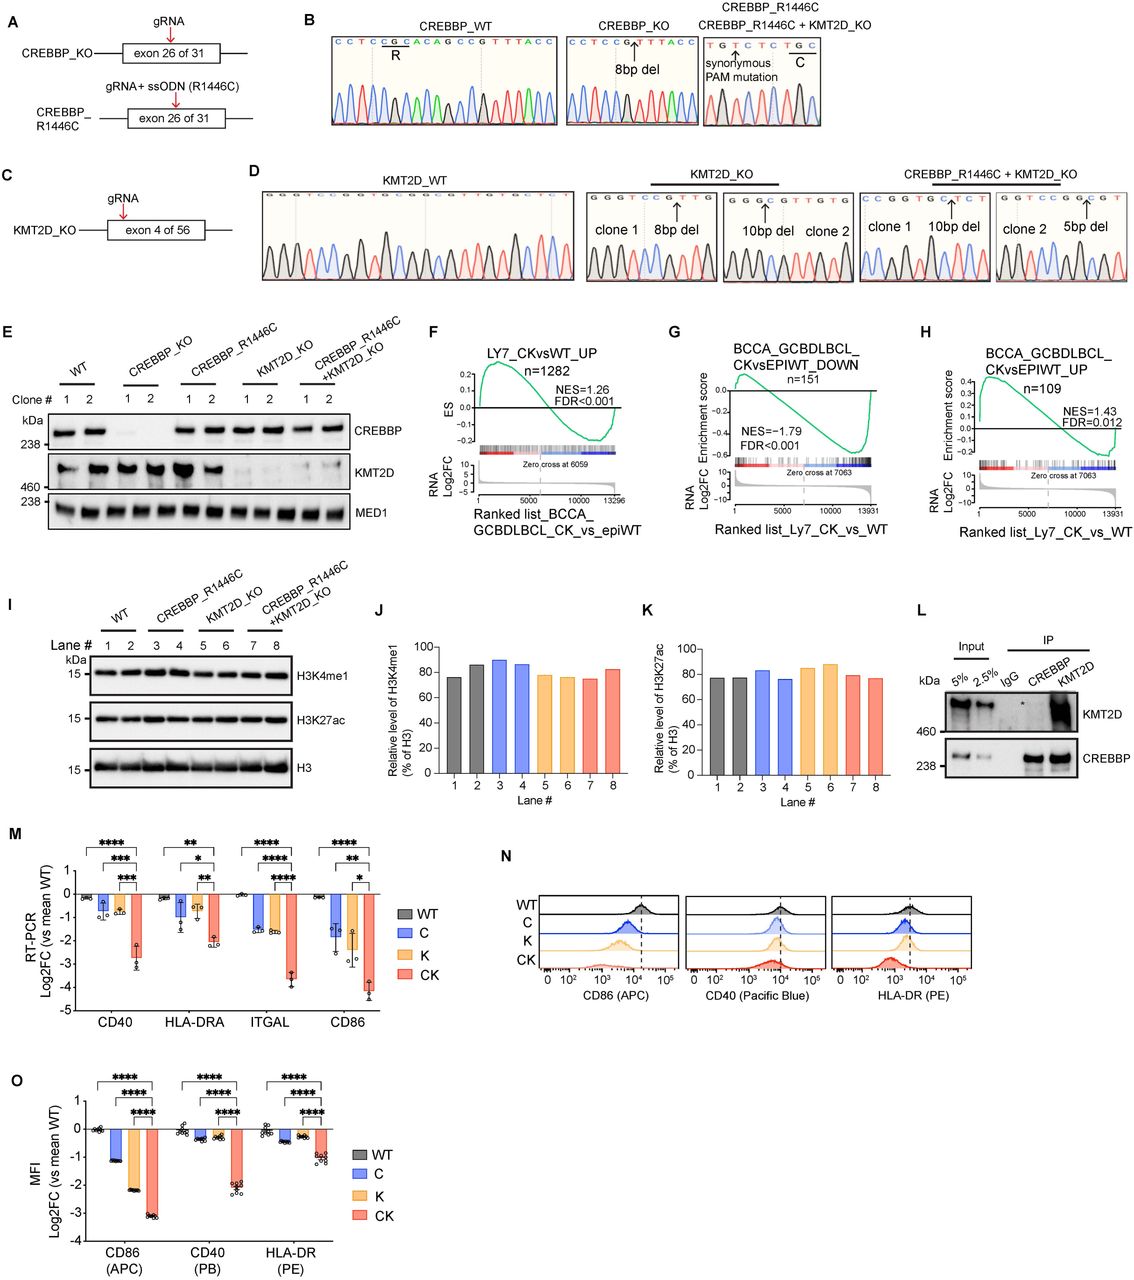
Figure Lengend Snippet: A , Experimental design for generating CREBBP -KO and CREBBP -R1446C, an enzymatically dead mutant, OCI-Ly7 cell lines. ssODN: single-stranded oligodeoxynucleotide. B , Sanger sequencing chromatogram confirming the homozygous knock out or R1446C point mutation in CREBBP . C , Experimental design for generating KMT2D -KO OCI-Ly7 cell line. D , Sanger sequencing chromatogram confirming the homozygous knock out of KMT2D . E , Immunoblotting for endogenous CREBBP and KMT2D in the indicated isogenic OCI-Ly7 cell lines using MED1 as internal loading control. F , GSEA plot using CK vs WT upregulated genes in OCI-Ly7 as the gene set against a ranked gene list based on CK vs epigenetic WT RNA-seq datasets of human BCCA cohort GCB-DLBCL patients. NES, normalized enrichment score. The p value was calculated by an empirical phenotype-based permutation test. The FDR is adjusted for gene set size and multiple hypotheses testing. G-H , GSEA plots using CK vs epigenetic WT ( G ) downregulated or ( H ) upregulated genes in human BCCA cohort GCB-DLBCL patients as the gene set against a ranked gene list based on CK vs WT OCI-Ly7 RNA-seq datasets. NES, normalized enrichment score. The p value was calculated by an empirical phenotype-based permutation test. The FDR is adjusted for gene set size and multiple hypotheses testing. I , Immunoblot for H3K4me1, H3K27ac and H3 in isogenic OCI-Ly7 cells. J-K , Relative densitometry of ( J ) H3K4me1 and ( K ) H3K27ac for panel I . L , Co-IP for assessing interaction between endogenous CREBBP and KMT2D in human SUDHL4 GCB-DLBCL cell line. M , RT-qPCR of indicated genes in different isogenic OCI-Ly7 cells. qPCR signal for each gene was normalized to those of HPRT and then mean WT and presented as log2 fold-change ± SEM. Statistical significance was determined using ordinary one-way ANOVA followed by Tukey-Kramer’s multiple comparisons test (**p < 0.01, ***p < 0.001, ****p < 0.0001). N , Stacked flow cytometry histograms showing the progressive signal decrease for the indicated surface markers in C, K, and CK-deficient OCI-Ly7 cells compared to WT. O , FACS measuring cell surface levels of the indicated markers in different isogenic OCI-Ly7 cells. Mean fluorescence intensity (MFI) of each surface marker was normalized to mean WT and presented as log2 fold-change ± SEM. Each dot represents a biological replicate. Statistical significance was determined using ordinary one-way ANOVA followed by Tukey-Kramer’s multiple comparisons test (****p < 0.0001).
Article Snippet: HiFi Cas9 Nuclease (IDT; 1081061), Alt-R CRISPR-Cas9 tracrRNA (
Techniques: Mutagenesis, Sequencing, Knock-Out, Western Blot, Control, RNA Sequencing, Co-Immunoprecipitation Assay, Quantitative RT-PCR, Flow Cytometry, Fluorescence, Marker
Journal: bioRxiv
Article Title: Cooperative super-enhancer inactivation caused by heterozygous loss of CREBBP and KMT2D skews B cell fate decisions and yields T cell-depleted lymphomas
doi: 10.1101/2023.02.13.528351
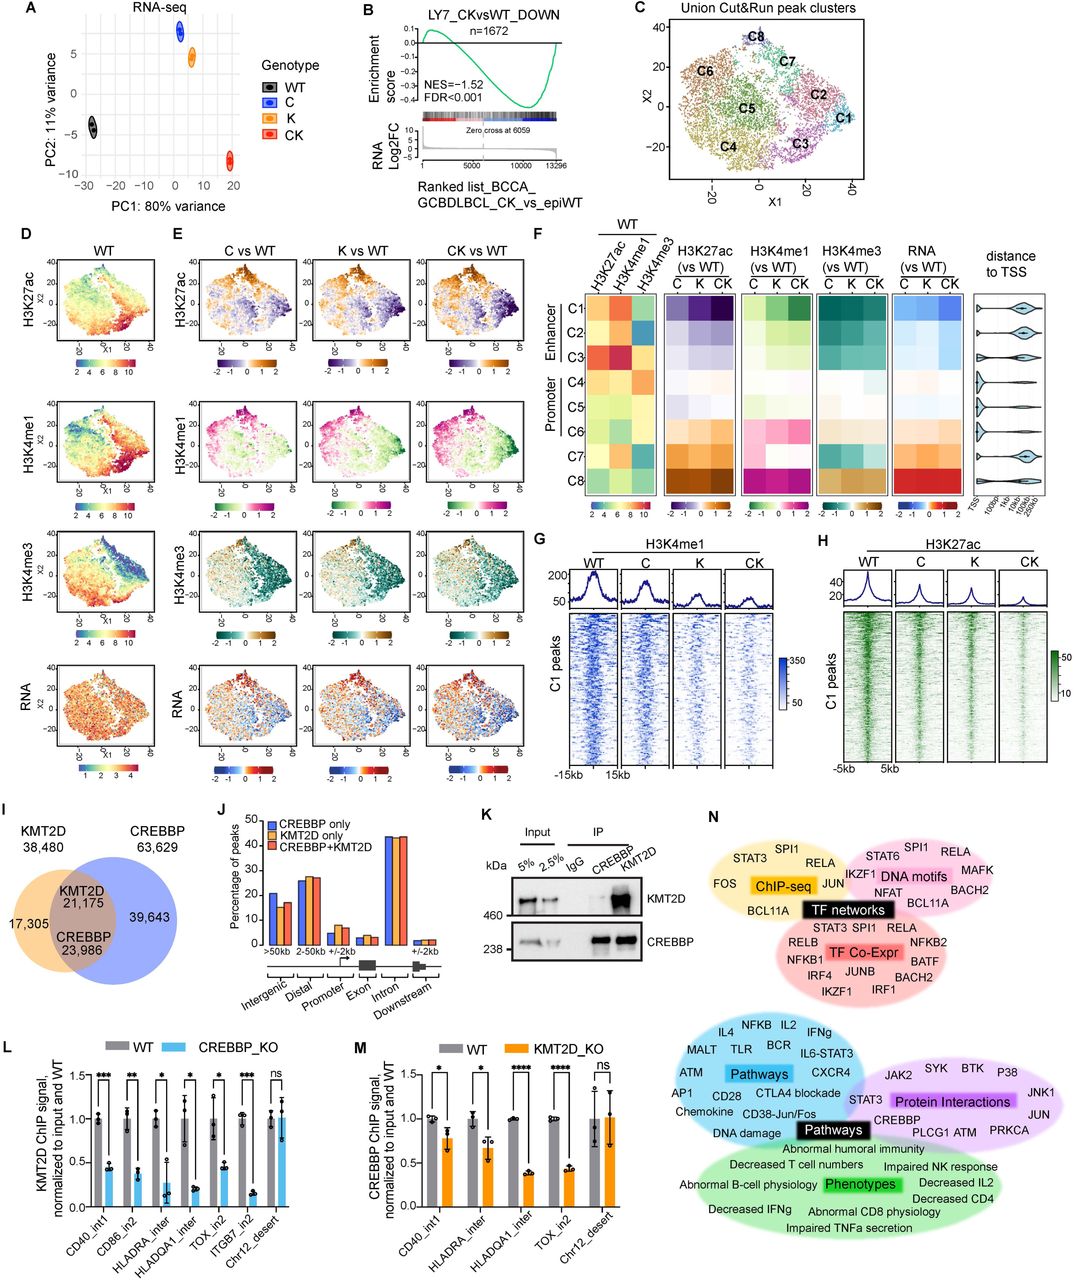
Figure Lengend Snippet: A , PCA analysis of RNA-seq datasets done in isogenic human OCI-Ly7 GCB-DLBCL cell lines (n=2 per genotype) using all genes normalized by VST. B , GSEA plot using CK vs WT downregulated genes in OCI-Ly7 as gene set against ranked gene list based on CK vs epigenetic WT (epiWT, no mutations in CREBBP , KMT2D , and EZH2 ) RNA-seq datasets of human BCCA cohort GCB-DLBCL patients. NES, normalized enrichment score. The p value was calculated by an empirical phenotype-based permutation test. The FDR is adjusted for gene set size and multiple hypotheses testing. C , t-SNE dimensionality reduction and K-means clustering of union peaks, generated by taking the union of H3K4me3, H3K4me1, and K3K27ac CUT&RUN signals from all isogenic OCI-Ly7 cell lines (WT, C, K, and CK), produced eight distinct clusters (named as C1-C8). D , t-SNE plots showing the basal level and distribution pattern of the indicated histone marks or RNA in WT OCI-Ly7 cells. The projected values are VST normalized counts. E , Read density changes for the indicated histone marks and RNA were projected onto t-SNE plots. The projected values are log2FC signal between the indicated genotypes. F , Heatmaps showing median VST normalized read density (left) or read density change (median log2FC) in C/K/CK relative to WT (middle and right) of the indicated histone marks or RNA-seq for each cluster defined in panel C . Distance to TSS plot shows the distance of union peaks to their closest TSSs. G-H , Average signal profiles (top) and heatmaps (bottom) displaying ( G ) H3K4me1 and ( H ) H3K27ac CUT&RUN signals around peak summit (+/-15kb) or peak center (+/-5kb), respectively at C1 peak regions. I , Venn diagram displaying overlap between CREBBP and KMT2D ChIP-seq peaks in OCI-Ly7. J , Genomic feature annotation of CREBBP-unique, KMT2D-unique, and CREBBP/KMT2D-co-bound ChIP-seq peaks. The definitions for different genomic features are depicted below the bar plot. K , Co-IP for assessing interaction between endogenous CREBBP and KMT2D in OCI-Ly7. CREBBP, KMT2D and IgG control were immunoprecipitated from OCI-Ly7 nuclear extracts. Western blots were performed using anti-CREBBP and KMT2D antibodies. L-M , ChIP-qPCR quantifying binding of endogenous ( L ) KMT2D and ( M ) CREBBP at the indicated gene loci in the indicated isogenic OCI-Ly7 cell lines. ChIP signals from three independent experiments were normalized to input and then to WT and presented as mean ± SD. The p values were calculated by unpaired t test and BH adjusted for multiple comparisons and denoted as follows: ns p > 0.05; *p < 0.05; **p < 0.01; ***p < 0.001; ****p < 0.0001. N , Functional annotation of C1 genes (n=401) by Enrichr and Toppgene ( , ).
Article Snippet: HiFi Cas9 Nuclease (IDT; 1081061), Alt-R CRISPR-Cas9 tracrRNA (
Techniques: RNA Sequencing, Generated, Produced, ChIP-sequencing, Co-Immunoprecipitation Assay, Control, Immunoprecipitation, Western Blot, ChIP-qPCR, Binding Assay, Functional Assay
Journal: bioRxiv
Article Title: The MICOS Complex Regulates Mitochondrial Structure and Oxidative Stress During Age-Dependent Structural Deficits in the Kidney
doi: 10.1101/2024.06.09.598108
Figure Lengend Snippet: (A–D) Quantitative polymerase chain reaction (qPCR) analyzing the gene transcript fold changes of Opa-1 and MICOS across aging: (A) Opa1 transcripts, (B) Mitofilin transcripts, (C) Chchd3 transcript, and (D) Chchd6 transcripts. (E) Western Blot of OPA1, mitochondrial dynamic proteins, and MICOS protein expression. For all panels, error bars indicate SEM, and Mann–Whitney tests were used for statistical analysis. Each dot represents an individual qPCR run (n=4). Significance values indicate ***P ≤ 0.001 and ****P ≤ 0.0001. For all western blotting experiments, n = 4.
Article Snippet: All cell types were infected with the following adenoviruses for gene knockouts: control CRISPR/Cas9 (sc-418922),
Techniques: Real-time Polymerase Chain Reaction, Western Blot, Expressing, MANN-WHITNEY

Journal: bioRxiv
Article Title: The MICOS Complex Regulates Mitochondrial Structure and Oxidative Stress During Age-Dependent Structural Deficits in the Kidney
doi: 10.1101/2024.06.09.598108
Figure Lengend Snippet: (A-E) Individual knockout (KO) of Opa1 , Mitofilin , Chchd3 , and Chchd6 and representative transmission electron micrographs. (F–H) quantification upon KO state of each MICOS gene and Opa1 (n = 10 cells) was performed in 3-D reconstruction: (F) average single mitochondrion area, (G) average single mitochondrion perimeter, (H) average single mitochondrion circularity index, and (I) average single mitochondrion length across individual MICOS KO. (J) 4′,6-diamidino-2-phenylindole (DAPI) staining, MitoPY1 (5 uM, 45 min at 370 c magnification of 60x), and merge channels in scramble-siRNA (control), MIC60-siRNA ( MITOFILIN KD), and CHCHD6-siRNA ( CHCHD6 KD) transfected permeabilized HEK293 cells. (K) 4′,6-diamidino-2-phenylindole (DAPI) staining, MitoBright Deep Red (10 uM, 30 min at 37 0 c), DCFDA (10 uM, 30 min at 37 0 c, magnification of 60x), and merge channels in scramble-siRNA (control), MIC60-siRNA ( MITOFILIN KD), and CHCHD6-siRNA ( CHCHD6 KD) transfected permeabilized HEK293 cells. (L) Plate reader-based reactive oxygen species (ROS) quantification. (M) Microscopy-based ROS quantification of MitoPY1 orange, (N) DCFDA, and (O) MitoSox Deep Red. For all statistical tests, a one-way ANOVA statistical test was performed with Dunnett’s multiple comparisons test. For 3D microscopy, each dot represents a mitochondrion, with their number varied between control (n=81), Opa1 KO (n=153), Chchd3 KO (n=139), Chchd6 KO (n=180), and Mitofilin KO (n=156). Significance values indicate *P ≤ 0.05, **P ≤ 0.01, ***P ≤ 0.001 and ****P ≤ 0.0001; ns, not significant.
Article Snippet: All cell types were infected with the following adenoviruses for gene knockouts: control CRISPR/Cas9 (sc-418922),
Techniques: Knock-Out, Transmission Assay, Staining, Control, Transfection, Microscopy

Journal: bioRxiv
Article Title: The MICOS Complex Regulates Mitochondrial Structure and Oxidative Stress During Age-Dependent Structural Deficits in the Kidney
doi: 10.1101/2024.06.09.598108
Figure Lengend Snippet: (A) Representative traces of mitochondrial calcium uptake in scramble-siRNA (control), MIC60-siRNA ( MITOFILIN KD), and CHCHD6-siRNA ( CHCHD6 KD) transfected permeabilized HEK293 cells. (B) Percentage of mCa2+ uptake rate calculated from (C) representative traces of mitochondrial calcium retention capacity in control, MITOFILIN KD, and CHCHD6 KD HEK293 cells. The number of boluses of calcium taken up by cells is shown in circles. (D) Percentage change in mitochondrial calcium retention capacity calculated from representative traces of mitochondrial calcium retention capacity. (E) Western blot showing siRNA-mediated KD of CHCHD6 /CHCHD6 in HEK293 cells. (F) Western blot showing siRNA-mediated KD of MITOFILIN /MIC60 in HEK293 cells. (G) Serial block face scanning electron microscopy obtained representative images of mitochondria endoplasmic reticulum contact site morphology overlaid on orthoslice and (H) isolated in three dimensions in three-month and (I-J) 2-year samples. For all statistical tests, one-way ANOVA statistical test was performed with Dunnett’s multiple comparisons test. N=3-5 for all calcium experiments, as run in triplicates. Significance values indicate **P ≤ 0.01.
Article Snippet: All cell types were infected with the following adenoviruses for gene knockouts: control CRISPR/Cas9 (sc-418922),
Techniques: Control, Transfection, Western Blot, Blocking Assay, Electron Microscopy, Isolation